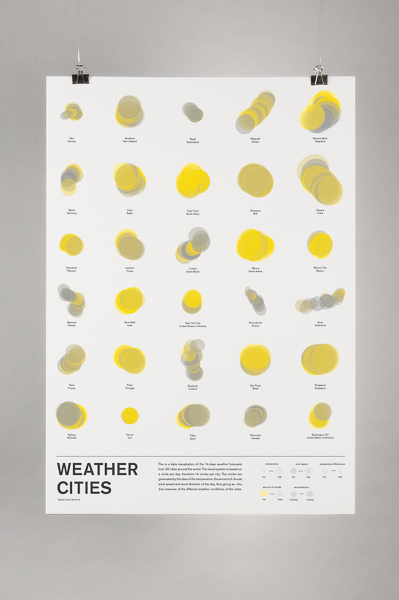

WEATHER CITIES
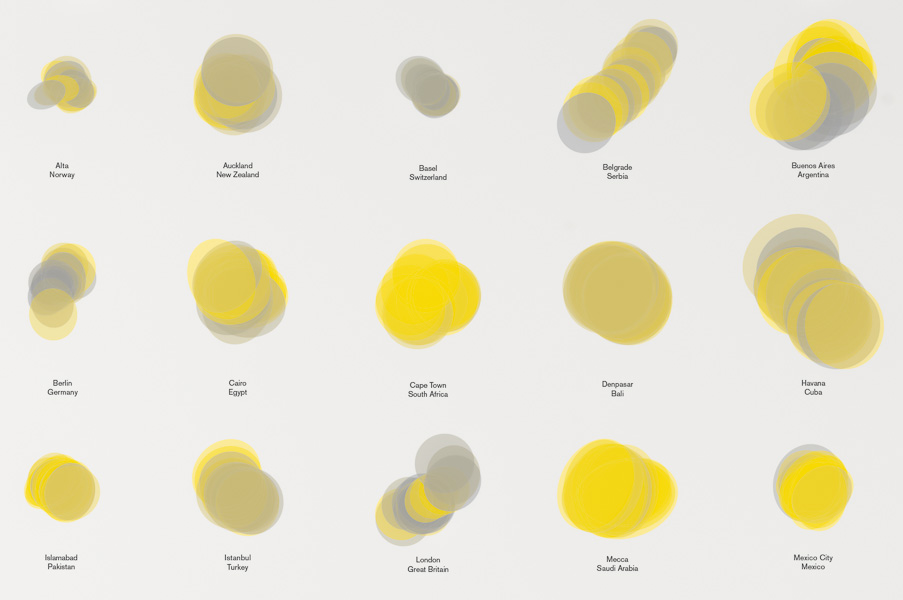
this is a data visualization of the 14-days weather forecasts
from 30 cities around the world in november '13. the visual system
is based on a circle per day, therefore 14 circles per city.
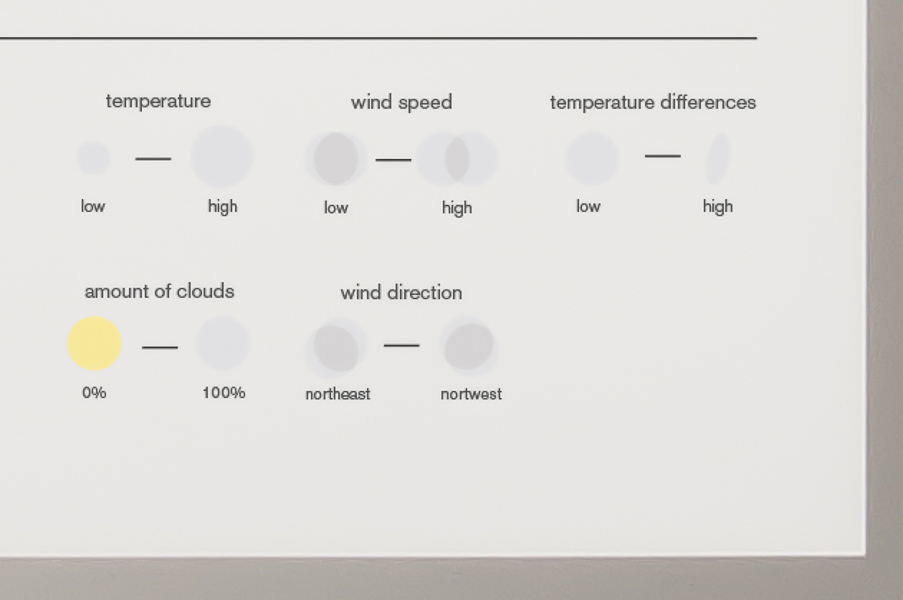
the circles are generated by the data of the temperature, the amount
of clouds, wind speed and wind direction of the day, thus giving
an intuitive overview of the different weather conditions of the cities.
format: A2
created with: basil.js
tutor: ludwig zeller
subject: data visualization
time: september 2013
context: fhnw hgk basel
